
Vibe Coding a Dashboard with Mock Data
A fixture-first method for building a dashboard that survives real numbers
 Voiskey Team
Decide the Questions It Answers
Vibe Coding a Dashboard is a design decision before it is a prompting decision. Write the three questions the screen must answer, in the order a user asks them. A weekly operations view might answer: are we ahead or behind, which area is causing the gap, and what changed since last week. Every widget you build must serve one of those questions. If a chart answers a fourth question, move it to a separate view. This short list is the contract you will speak against, and it prevents the most common dashboard failure, which is a wall of charts that looks busy but answers nothing in particular.
Name the person who opens the screen and the decision they make from it. A support lead scanning volume needs a different first row than a finance partner checking spend, even when both care about the same numbers. Write the decision in one sentence: if the gap is growing, the lead reassigns two people. That sentence tells you which number belongs at the top, which comparison matters, and how much detail the second row needs. When the audience and the decision are written down, layout arguments become testable questions about whether a widget helps someone act. That test is more useful than taste.
Choose one primary measure and define it before any chart. Say what it counts, the period it covers, and what it is compared with. A measure without a comparison is a number that cannot be judged, so pair it with a target, a previous period, or a trend. Speak the definition once and reuse it in every widget label, so the top card and the detail chart cannot disagree. If two teams define the same word differently, decide which definition the screen uses and note the difference. Ambiguity in a measure is invisible in a mock and expensive after launch.
Decide what the dashboard will not show in this version. A first build often needs only a summary row, one trend, and one breakdown. Write the exclusions, such as individual records, export, and per-team filters, then keep them out of the layout. This protects the afternoon and keeps the review focused on whether the three questions are answered. When the first version is right, the next version can add a view rather than redesign the first one. A dashboard that grows by addition stays understandable; one that grows by redesign loses the decisions that made it useful. Keep the exclusion list in the readme.
Shape Mock Records to Match Real Ranges
Build fixtures that look like the real thing at its edges, not only in the middle. Take a real report or a sample export and copy its shape: the number of rows, the ranges, the gaps, and the long labels. Then write a seed list with one normal week, one very quiet week, one very busy week, and one week with a missing value. These four fixtures will exercise every widget you build, and they cost a few minutes. A dashboard tested only on tidy sample rows is a dashboard that has never met a real Tuesday. Four fixtures are enough to start.
Give each fixture a name and a purpose so a reviewer knows what it is for. A file called busy-week exists to test long labels and crowded bars; a file called quiet-week exists to test a zero that is real rather than an error. Write a one-line comment at the top of each fixture. Then use the name in every request, for example: load the busy week fixture and check that the region labels do not overlap. Named fixtures turn visual review into a repeatable check, and they stop the team from arguing about which numbers were on screen.
Include values that break naive formatting: a very large number that would overflow a card, a zero, a negative value if the measure allows one, a missing value, and a label that is far longer than the others. Ask for each to be handled in a stated way rather than truncated silently. Speak the rule: a large number is shortened with a unit, a missing value shows a dash rather than a zero, and a long label wraps to two lines. These rules are small, and they are the difference between a chart that stays readable and one that turns into overlapping text on the first busy day.
Keep the fixture generator in the repository so the shapes can be regenerated. A generator with a fixed seed produces the same rows for every reviewer, which is what makes a visual comparison meaningful. Write the seed and the row count in the readme. If the real source has a distribution you know, such as many small values and a few large ones, say so and shape the generator to match. The goal is not realism for its own sake; it is that the widgets meet the conditions they will meet later, while the cost of a change is still one line in a generator.
Lay Out Widgets by Decision Order
Place the answer to the first question at the top left, because that is where a reader starts. The summary row should contain three to five numbers at most, each with the comparison that makes it meaningful. Then place the trend that shows direction, then the breakdown that explains the cause. Speak this order as a sequence and ask for the layout to follow it at every width. When the order is fixed, a narrow screen can stack the same sequence rather than inventing a different priority, which keeps the reading experience consistent across devices. Write the sequence down before you speak.
Give each widget a title that states its question rather than its chart type. A title such as revenue by region answers a question; a title such as bar chart does not. Speak the title and the subtitle together, where the subtitle names the period and the comparison. Then check the titles in sequence: a reader should be able to read the three titles and understand the story without looking at the charts. If the titles do not form a story, the layout is probably organized by what was easy to build rather than by what the reader needs. Fix the titles before the charts.
Use one grid and one spacing scale for the whole screen. Speak the number of columns, the gap, and the minimum width for a card, then ask for every widget to snap to that grid. Mixed widths are acceptable when they reflect importance, such as a full-width trend above two half-width breakdowns, but they should be a decision rather than an accident. Check a narrow width and a wide width after each addition, and note any card that jumps to a different row. A stable grid makes the screen feel calm and makes later additions cheap, and it makes the review faster.
Reserve the filters for a single row and state their order. A dashboard with filters scattered across the header, the sidebar, and the cards is hard to explain and harder to reset. Speak the filter order and the scope of each one, then name the control that clears all filters. If a filter affects only one widget, say so in the widget rather than in the global row. When scope is clear, a user can predict what a change will do before making it, and a reviewer can test the combinations that matter instead of every possible arrangement. Write that scope in the filter note.
Review Charts With Edge Values
Review each widget with the edge fixtures rather than the normal one. Load the quiet week and check that a real zero is not drawn as an error. Load the busy week and check that labels stay readable and bars do not overlap. Load the fixture with a missing value and check that the gap is stated rather than hidden. Speak each check as a question, such as: does the trend line break at the missing week, and does the legend still explain the line. Edge reviews catch formatting problems that a polished screenshot hides. Run all three fixtures in one sitting.
Check the axis and the scale deliberately. A truncated axis can make a small change look dramatic, and a full axis can make a large change look flat. Speak the choice and the reason, then keep it consistent across widgets that share a measure. Check the units and the rounding in the labels, especially for large values and for percentages. If a number is shortened, say how and where the full value is available. A reader should never have to guess whether a bar represents thousands or millions, and a spoken unit rule prevents that guess. Apply the same rule to every chart.
Check the legend, the tooltip, and the empty state as part of the same review. A legend should name the series in the same words used elsewhere on the screen. A tooltip should repeat the measure, the period, and the comparison rather than only the number. An empty state should say what is missing and how to change the filter. Read all three aloud as a reader would, and note any wording that repeats or contradicts another widget. Consistency across these small surfaces is what makes a dashboard feel trustworthy rather than assembled. Read every label as a visitor would, and note the ones that sound like internal shorthand.
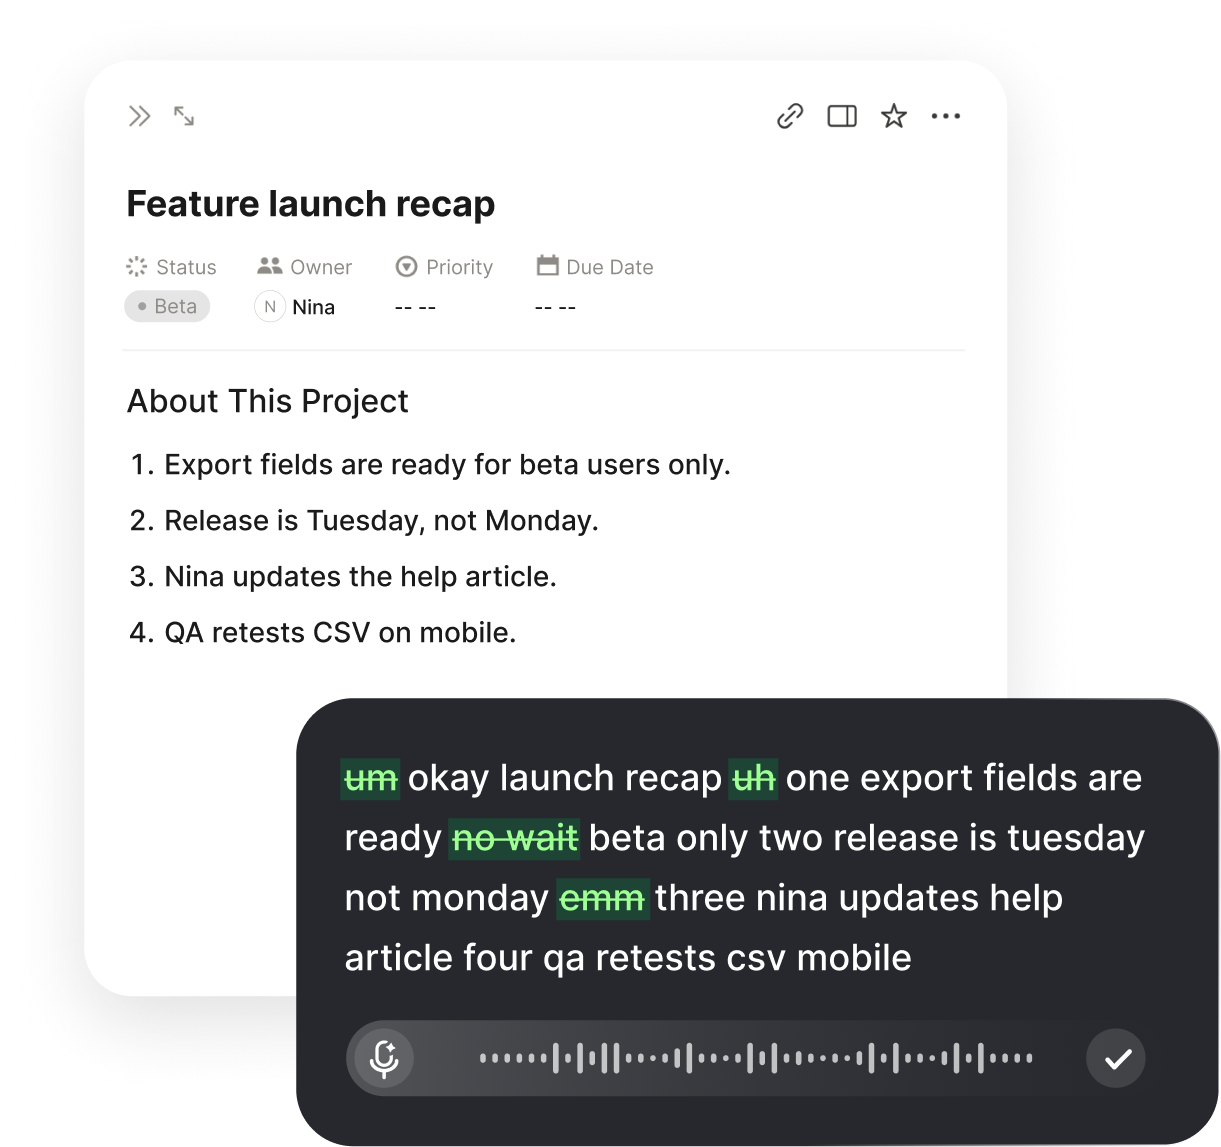
Use the spoken loop for the fixes the review produces. Put the insertion point in the widget file or the prompt field, hold the Voiskey shortcut, and say the change as one sentence with one expected result. Voiskey removes filler words and false starts and adapts punctuation to the field you are in, so a rule such as show a dash for a missing week arrives as a sentence you can keep beside the widget. Then reload the same fixture and confirm the change without touching the other widgets in the same pass. That patience keeps each change attributable to one sentence.
Swap Mock Records for the Real Source Later
Plan the replacement before you build the widgets. Put the fixture behind one loading function so the screen asks for rows in a single place. Then replacing mock records with the real source is a change to that function rather than a change to every card. Speak the boundary explicitly: the widgets receive a list of rows with these fields, and they do not know where the rows came from. A clear boundary is the most valuable part of a fixture-first build, because it keeps the layout work and the source work from becoming entangled. Write the function name in the note.
Write down the field contract the widgets depend on. Name each field, its type, and whether a missing value is allowed. Then write one check that fails when the shape changes. When the real source arrives, run that check before wiring the screen to it. Most integration surprises are shape surprises, such as a count that arrives as text or a period that arrives in a different order. A short contract note makes those surprises visible in minutes rather than in a broken chart that nobody can explain during a review. Keep the note beside the loading function and update it whenever the shape changes.
When you want the same workflow on your own machine, download Voiskey for Mac and Windows and keep the shortcut ready while the widget files are open. Voiskey turns a spoken request into text at the insertion point, including file names and paths when you name them, which suits dashboard work where a request often names a fixture and a component. It removes filler and self-corrections and adapts formatting to the field, so the rule about a missing week arrives in publishable form. The spoken request then matches the note, which matches the check. A reader can then follow the reasoning from note to code.
Finish by writing the swap plan in the readme: which function changes, which check must pass, and which fixtures stay for testing after the real source is connected. Keep the quiet, busy, and missing-value fixtures even after the swap, because they remain the fastest way to review a layout change. A dashboard is never finished, but it can be replaceable in small steps, and that is a better goal than a single large migration. When the source changes again, the plan is already there and the next swap is routine. Close the notes with the date of the last review and the name of the person who ran it.
FAQ s
Voiskey is a voice typing app for desktop use. You press a shortcut, speak the widget or layout request, and the text appears at the insertion point in your component file. It removes filler words and self-corrections, so a title and a placement rule can be reviewed as one clean sentence.
Voiskey learns names, jargon, acronyms, and spelling preferences, so repeated widget and field names become easier to reproduce. Saying an unusual label once in context helps. A short glossary beside your notes gives the same wording for every later request.
Speak the trigger, the message, and the action that resolves it in one sentence. Voiskey clears self-corrections and adapts punctuation to the field, so the revised wording lands as the version you meant. Keep the insertion point in the widget file and confirm the result.
Yes. Voiskey works at the system level, so after you press the shortcut and speak, the text appears wherever the insertion point sits. That includes a component file, a style file, or a prompt field, which keeps layout requests next to the code they describe.


 Voiskey
Your voice, amplified.
Download Voiskey for Mac and Windows and speak the next dashboard change.
Use it across macOS, Windows, iOS, and Android